WP 6 Validation of project products Results from WP 6 Validation of project products The validation of BgCWFS results consists of two types of analysis – comparison to observations at background AQ stations and AERONET sites, and model-intercomparison using products from the CAMS regional and global forecasts and from the EMEP-MSC-W simulations. Model performance is focused on surface concentrations (PM10, PM2.5, NO2 and SO2) and columnar parameters (AOD, NO2_C and SO2_C). The timeframe covers two months – August 2017 and February 2019, the spatial scale – two domains Balkan Peninsula and Bulgaria. The analysis is based on various statistical indicators and graphical visualizations - box plots, density distribution functions, scatterplots, and maps for the spatial distribution at surface level. Examples of some results:
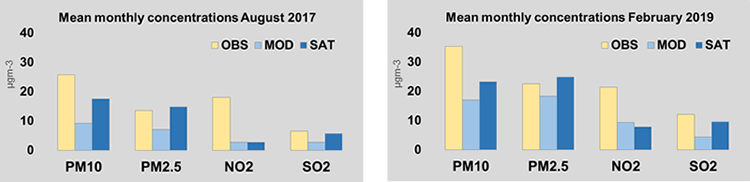
Mean monthly concentrations of PM10, PM2.5, NO2 and SO2 (µg/m3) in August 2017 and February 2019
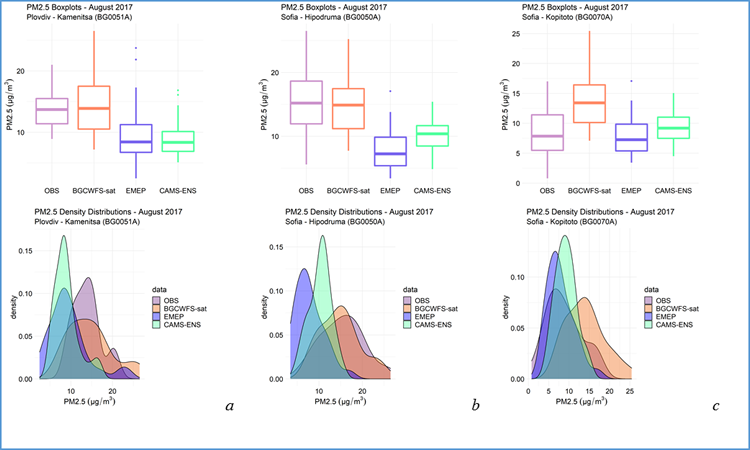
PM2.5 in August 2017: modelled vs observed concentrations for
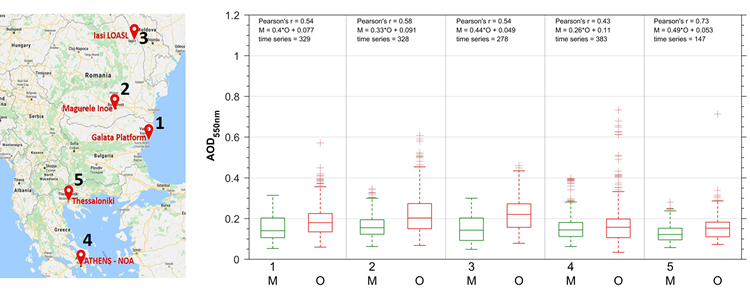
AOD550 in August 2017- box plots for observations (O) and BgCWFS-base case (M)
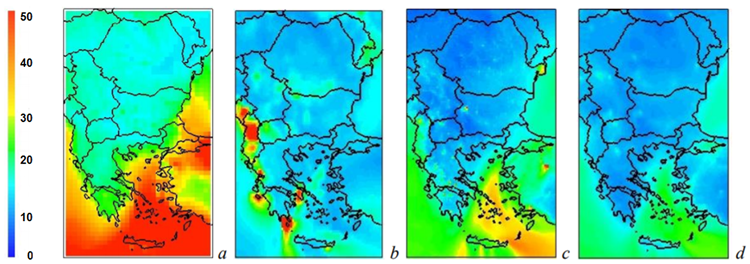
PM10 [μgm-3] monthly mean for August 2017:
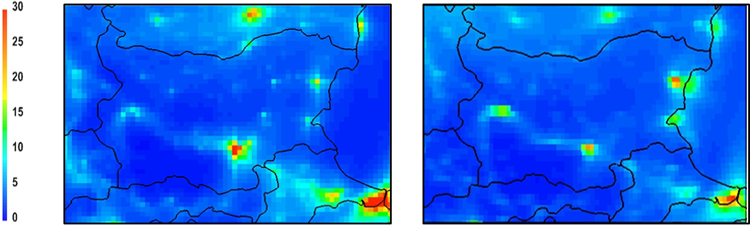
NO2 [μgm-3] monthly mean for February 2019: a) BgCFWS_sat and b) EMEP |
|

![]()
![]()
![]()
![]()
![]()
![]()
![]()
![]()
![]()
![]()
![]()