WP 4 Assimilation of satellite data in Bulgarian Chemical Weather Forecast System (BgCWFS) Results from WP 4 Assimilation of satellite data in Bulgarian Chemical Weather Forecast System (BgCWFS)
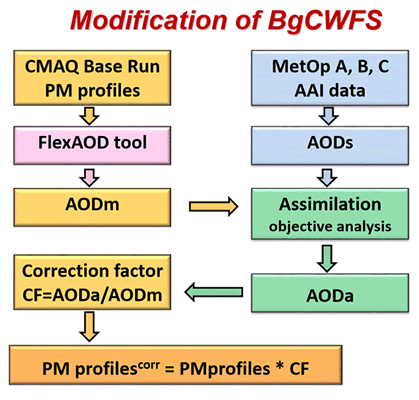
The BgCWFS was upgraded for offline work and for āssimilating satellite retrived data for the atmospheric composition (AOD, vertical column densities of SO2 and NO2).
Fig. 1. Modification of the Bulgarian Chemical Weather Forecast System
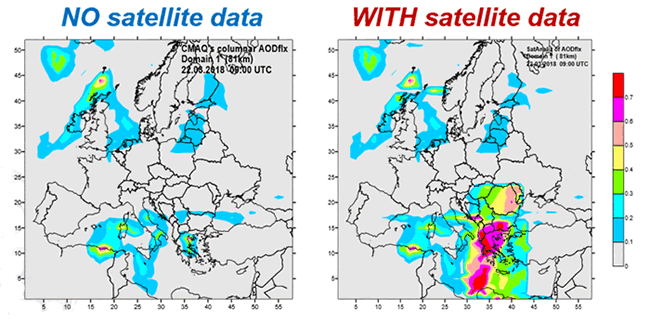
Satellite data is directly assimilated in the first three domains of BgCWFS – Europe (resolution 81 km), Balkans (27 km), and Bulgaria (9 km). The method of Optimal Interpolation is chosen for the assimilation of Aerosol Optical Depth (AOD) data by GOME-2 instrument on board of MetOP satellites. Results for the AOD from the modified BgCWFS without use of satellite information (base run) and with assimilated satellite data are presented in Figure 2.
Fig. 2. Maps of AOD, showing the Saharan Dust outbreak towards Bulgaria on 22.03.2018,
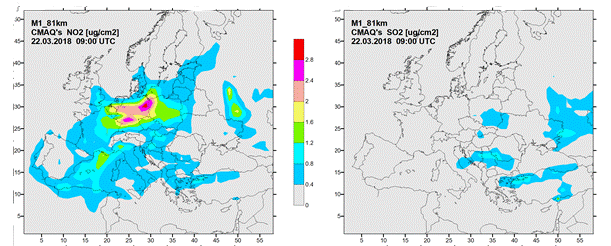
Fig. 3. Maps of the columnar NO2 (left) and SO2 (right) simulated by BgCWFS for 22.03.2018 at 09:00 UTC
For studying the performance of the BgCWFS, two past periods of one month each, have been investigated - August 2017 and February 2019. For each month BgCWFS was run in two modes: base run ("mod") and run with assimilation of satellite data ("sat"). Figure 4 shows, as example, the effect of satellite data assimilation on the AOD field in domain Balkans on 22.08.2017 at different hours of the day – before, at , and after the satellite overpass time Hs (Hs = 09:00 UTC).
Fig. 4. Time evolution of the difference AOD "sat-mod" caused by satellite data assimilation
Figure 5 illustrates the difference in AOD ("sat" – "mod") over the three nested domains (Europe, Balkans, Bulgaria), at the hour of the satellite overpass time over Bulgaria (Hs=09:00 UTC).
Fig. 5. AODsat - AODmod : fields on 01.08.2017 for the first 3 BgCWFS domains at moment Hs
Figure 6 gives the picture of the mean monthly PM10 concentration in domain Bulgaria for February 2019, simulated by BgCWFS in "mod" and "sat" versions.
Fig. 6. Mean monthly concentrations of PM10 [μgm-3] for February 2019,
|
|


